Using 2 Proportions Test with SigmaXL
A 2 Proportions Test is a statistical procedure used to validate if two independent groups have significant differences in their proportions. We can use this test to compare, for example, if the proportion of one group is significantly higher than the other.
Let’s look at the following example concerning two independent groups of people in the same city. The first group was interviewed in an affluent neighbourhood, the second, in an impoverished neighbourhood. The survey asked both groups if they thought that level of education yields better outcomes in life. The research team was testing if the affluent neighborhood group would answer “YES” proportionally more than the second group.
Here’s the breakdown of the information:
- 241 out of 600 interviewed (first group, affluent neighbourhood) said “YES” to the question.
- 160 out of 500 interviewed (second group, impoverished neighbourhood) said “YES” to the question.
The Null Hypothesis in this case is that there is no difference between the proportions of “YES”es answered by both groups. The Alternative Hypothesis is that the first group will answer with more “YES”es to this specific question, proportionally speaking.
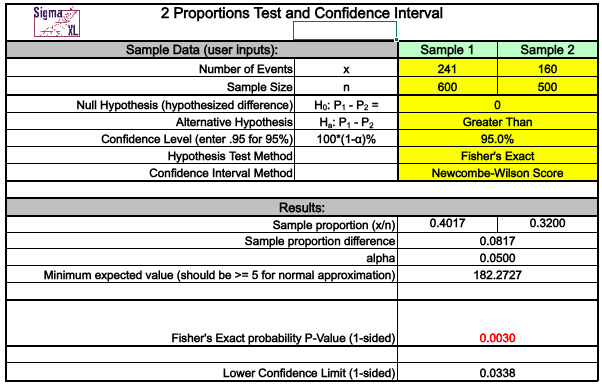
Using SigmaXL we can simply plug in the numbers (Sample 1 and Sample 2) and ensure that the alternative hypothesis in this case is set to “Greater Than”. We are also using the standard confidence level of 95%.

The resulting p-value is 0.0030 which is less than the set alpha risk of 0.05 (or 5%). We therefore reject the Null Hypothesis in favour of the Alternative. There is statistical significance to support the research team that affluent neighbourhoods tend to believe that more education yields better outcomes in life.
SigmaXL also provides further valuable information about the test results, as seen in the screenshots below.


Adapted from the book R Essentials for Six Sigma Analytics: An Introduction to R for the Six Sigma Practitioner. (Perdigao, R.), 2021.

I love Continuous Improvement and Data Analytics. The world would be a better place if our kids were taught more process excellence and statistical analysis at school.