
Hypothesis Testing – Looking for Statistical Significance

Hypothesis Testing is a statistical procedure that looks into proving (or not) a constructed hypothesis. Also known as Significance Tests, they are powerful in investigating and validating changes in central tendency, variance, proportions, and relationships between two or more variables.
Null and Alternate Hypotheses
The Null hypothesis (Ho) states the status quo. It assumes that nothing is unusual, that there has been no change in the process, that “all are innocent until proven guilty.” We always state the Null hypothesis as what the phenomena being studied is expected to be. For example, the productivity between machines A and B has not changed since the latest improvement efforts or, a new drug has no effect in a specific run of treatment. The Alternate (Ha) or Alternative hypothesis states that there has been a change in the process or, that a new drug has made an effect in a run of treatment. With the Ha, something has changed.
Confidence Levels, Risk, and Types of Errors
Since we assume the Null to be true (the status quo) in a hypothesis test, we will always try to prove that the Alternate hypothesis has in fact had an effect – as in the judiciary system where “the burden of proof is on the prosecutor.”
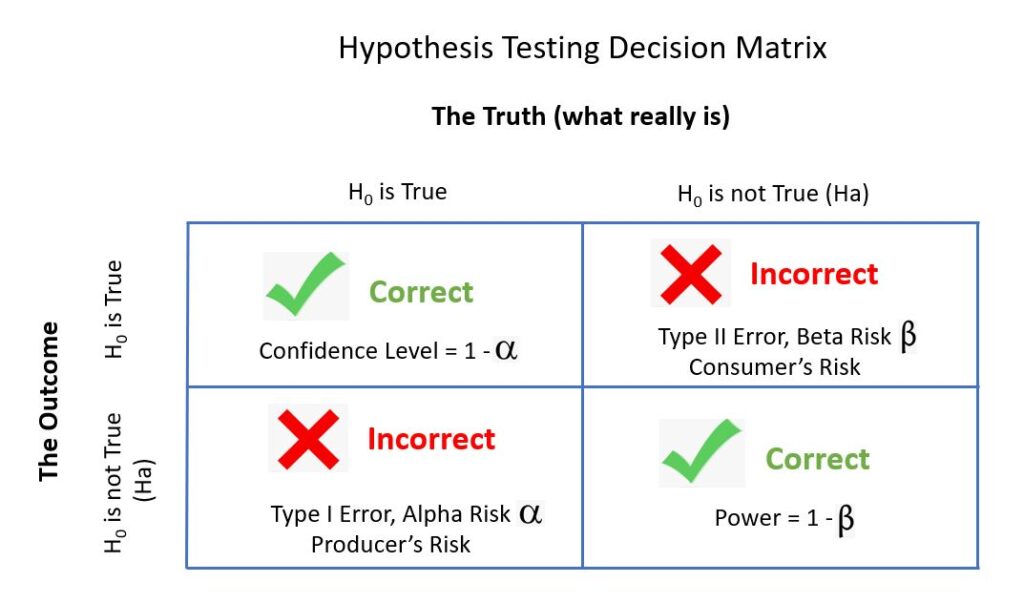
If we incorrectly reject the Null hypothesis in favour of the Alternate (for example, if the outcome of a trial is guilty for someone who is in fact innocent) we commit a Type I error. This incorrect outcome is related to the alpha risk, sometimes referred to as the producer’s risk. The confidence level in this case is 1 – alpha. So, if we say that we are 95% confident that we the outcome is the correct one, it also means that we are taking a 5% chance of committing a Type I error.
If we incorrectly fail to reject the Null hypothesis (in this case, an acquittal for an actual guilty person) we commit a Type II error. This incorrect outcome is related to the beta risk, sometimes referred to as the consumer’s risk. As confidence level and alpha risk sum up to 100% so does Power and the beta risk for Type II errors (for example, a beta risk of 20% means power of 80%). Power is the probability that a test of significance will detect a deviation from the null hypothesis, should such a deviation exist.