
Most transformation efforts don’t fail because change is hard. They fail because organizations are solving the wrong problem.
Study after study confirms that somewhere between 60 and 70 percent of organizational change initiatives fail to achieve their intended objectives. Most organizations know this statistic. Many have lived it. What is less understood is why the failure rate has stayed stubbornly constant despite decades of investment in change management methodology.
This paper argues that the high failure rate is not a mystery. It is a predictable outcome of four structural mistakes that organizations make consistently, across industries and initiative types. We call this the Change Failure Stack: four interlocking failures across leadership, incentives, change management processes, and execution clarity.
WHAT'S INSIDE
Executive sponsors often publicly champion change while quietly ensuring it never gets the resources it needs — not from malice, but from the rational self-protection of someone whose role, authority, or identity is under threat.
Every change management framework acknowledges that incentives must align with new behaviors, yet the column in the project plan stays empty — this section explains why, what it costs, and what the authority question actually looks like in practice.
Organizations measure what is easy to count — open rates, attendance, completions — but none of it tells you whether employees know what to do differently on Monday morning.
Change initiatives are routinely designed against a current state that has never been formally observed, and the gap between the documented process and the actual process is where transformations quietly fail.
Practitioner Toolkit
EXECUTIVE SUMMARY
Most transformation efforts don’t fail because change is hard. They fail because organizations are solving the wrong problems when it comes to change. And, sadly, study after study confirms that somewhere between 60 and 70% of organizational transformation initiatives fail to achieve their intended objectives. Many organizations know this statistic. Most have lived it.
This paper argues that the high failure rate is not a mystery. It is the predictable outcome of four structural mistakes that organizations make, consistently, across industries and initiative types. The mistakes are not exotic. They do not require sophisticated diagnostic tools to identify. What they require is the willingness to be honest about things that are uncomfortable to say out loud – particularly when the people who need to hear them are sitting in the room.
We think of these mistakes as a system, a set of structural breakdowns that, when present, make failure predictable. In this paper, we refer to this as the Change Failure Stack: four interlocking failures across leadership, incentives, change management processes, and execution clarity.
The Change Failure Stack is not theoretical. It shows up in four specific, repeatable ways:
Each failure has a cost. Together, they are the reason the ~70% figure has stayed stubbornly constant despite decades of investment in change management methodology. This paper is written for the practitioner who wants an honest account of what goes wrong and a set of practical tools to prevent it. It does not introduce a new framework or propose that existing ones be retired.
FAILURE ONE
Start with the uncomfortable question that almost never gets asked directly: In what specific ways does this change threaten the leader who is sponsoring it?
It is an impolite question. It implies that the executive champion — the person who commissioned the initiative, approved the budget, and gave the keynote at the kickoff — may be working against the very outcome they are publicly committed to. And yet, in a significant number of failed transformations, that is precisely what is happening. Not through malice, but through the entirely rational response of a human being whose role, authority, or comfort are under threat.
Consider what a serious operational transformation typically asks of senior leaders. It may reduce their headcount, shrinking their organizational footprint and, with it, their influence. It may shift decision power to a different function, creating a peer who now has authority the leader previously held. It may make their team’s historical expertise less valuable or even obsolete.
It may move accountability for outcomes they currently control to a shared or matrixed structure.
It may, frankly, create a successor.
None of these are hypothetical. They are the ordinary mechanics of serious organizational change. And none of them are things a leader will raise in a steering committee meeting.
The result is what might be called performed alignment: a leader who says the right things, attends the right meetings, and signs off on the right documents, while quietly ensuring that the change never quite gets the resources, decisions, or protection it needs to succeed.
The signals are rarely dramatic. They manifest as scheduling conflicts that persistently push the initiative down the priority list. As decisions that require executive authority getting deferred, re-deferred, and eventually delegated to someone without the standing to make them. As budgets that were approved in principle but never fully released. As competing priorities that seem to materialize precisely when the change requires the most leadership support.
The project team interprets these as operational friction. They are not. They are data. They are telling you something about the nature of the sponsor’s commitment that no engagement survey will capture.
This is not a condemnation of leaders. It is a description of how incentive systems work. When an organization asks a senior leader to champion a change that diminishes their position, it is asking them to act against the incentives the organization has spent years reinforcing. Most people aren’t built to do that consistently or convincingly, regardless of how genuine their initial commitment may be.
CASE STUDY
12 Executives Yellow Belt certified, measurable gains in brokerage productivity within 12 months
A logistics company whose leaders endorsed change but lacked any framework to personally drive it. Adonis required executives to own real improvement projects and present results to senior leadership – making commitment observable rather than performative.
Genuine leadership commitment to a transformation has a specific and observable signature. It looks like a leader who can name – concretely, not abstractly – one thing they personally will do differently as a result of this change. It looks like a leader who participates in the hard conversations rather than delegating them. It looks like a leader who reallocates their own time and attention visibly, in ways the organization can see, rather than simply approving additional resources for the project team.
It also looks like a leader who is willing to be held accountable for adoption outcomes, not just delivery milestones. Delivery milestones measure whether the initiative was built. Adoption outcomes measure whether it worked. These are not the same thing, and most governance structures only track the former.
There is a meaningful difference between a leader who says ‘this transformation is critical for the business’ and one who says ‘here is specifically what I am changing about how I operate to make this successful.’ The latter is rarer, and far more predictive.
"The difference between a sponsor who supports a change and one who owns it is what they are personally willing to give up for it."
The most effective time to assess sponsor alignment is before the project charter is finalized, not after the initiative has stalled. This means having an explicit, structured conversation with the executive sponsor—ideally facilitated by someone with enough standing to ask uncomfortable questions—that surfaces the specific ways the change may threaten their interests and examines how those threats will be managed.
This is not a gotcha exercise. It is a risk management exercise. Leaders who have genuinely worked through their personal stake in the change are far better positioned to sustain their commitment when the initiative gets difficult, which it will. Leaders who have not done this work tend to drift, quietly and often unconsciously, back toward behaviors that protect the status quo.
TOOL
Leadership Alignment Assessment
A structured diagnostic administered to executive sponsors before project launch. Maps sponsor commitment across four dimensions: role impact (how the change affects the leader’s organizational position), incentive conflicts (ways the leader’s current incentives reward the opposite of the desired change), authority shifts (decision rights being gained or lost), and identity exposure (ways the change challenges what the leader is known for).
The assessment produces a scored output by dimension, a summary of highest-risk areas, and a structured conversation guide for sponsor preparation. It is not designed to disqualify sponsors. It is designed to surface the work that needs to happen before launch, rather than discovering it at the first sign of resistance.
TOOL
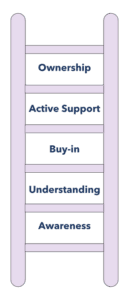
Sponsor Commitment Ladder
A five-level visual scale distinguishing between degrees of leadership commitment:
Most sponsors enter initiatives at the Buy-In level and are treated as if they are at Ownership. The Ladder makes that gap explicit. It is used at sponsor onboarding and revisited at 30, 60, and 90-day intervals throughout the initiative, particularly at inflection points when the initiative is under pressure.
FAILURE TWO
Open any change management framework – Kotter, ADKAR, Prosci, pick one – and somewhere in the model you will find an acknowledgment that incentives must align with desired new behaviors. In ADKAR, it is the Reinforcement stage. In Kotter, it is anchoring changes in the culture through systems and structures. The frameworks know. The practitioners know. The project plans include a column for incentives.
The column stays empty.
Or it gets populated with language that sounds like action but isn’t: ‘leadership recognition,’ ‘change champion program,’ ‘internal communications celebrating early adopters.’ These are not incentives. They are gestures. And the people whose behavior needs to change are not fooled by them, even when they are too polite to say so.
The reason incentives don’t actually change is straightforward: changing them is hard in ways that building a communications plan is not. Changing incentives means changing compensation structures, performance review criteria, promotion rubrics, and the metrics by which people are evaluated. It requires active involvement from Human Resources, Finance, and often Legal. It takes time that most project timelines do not accommodate. It requires people with authority over those systems to prioritize the change, and those people are frequently the same leaders whose own incentives are threatened by the initiative.
CASE STUDY
$27M in operational productivity in year one, surpassing the $17.5M target by more than 50%
A PE-backed specialty materials company stuck below 1% annual productivity gains due to absent governance and no accountability mechanism for improvement execution. Adonis built a framework with monthly performance reviews and benefits validation that made follow-through non-optional.
Here is what happens when incentives don’t change. Employees who are perfectly capable of understanding the new way of working look at their situation rationally. On one side: a new process or system that requires them to change established habits, accept a learning curve, and take on short-term risk. On the other hand, a performance review system, a bonus structure, and a set of metrics that continue to reward the old behaviors. They make a rational calculation. They comply with the new system visibly and continue the old behaviors functionally. They are not resistant. They are sensible.
This dynamic is one of the most expensive things that can happen to a transformation initiative. It produces adoption numbers that look acceptable – if adoption is being measured by system logins, training completion rates, or self-reported usage – while the actual behavioral change that the initiative was designed to produce does not materialize. The initiative closes. The metrics are declared a success. And six months later, performance metrics reveal that nothing actually changed.
Not every incentive change requires compensation restructuring. There is a spectrum of levers available, and practitioners who understand the full range are better positioned to find the ones that are both impactful and feasible within their organizational context.
| Incentive Lever | What It Looks Like in Practice |
| Formal financial | Bonus criteria, commission structures, pay band adjustments tied to adoption metrics |
| Performance management | KPI shifts, review criteria changes, promotion rubrics updated to reflect new behaviors |
| Social & recognition | Who gets celebrated, in what forum, for what specific behavior, not generic ‘innovation’ |
| Structural & positional | Role definitions, decision rights, organizational reporting that reflects the new operating model |
| Informal & cultural | What leaders pay attention to in meetings, what questions they ask, what they visibly reward with their own time and attention |
The hardest levers to pull—formal financial and performance management—have the most durable impact. The easiest levers—social recognition and informal cultural signals—have impact, but it fades quickly when the formal system continues to reward something different. A change that relies exclusively on the easy levers is a change whose adoption will erode over time, even if the initial numbers look encouraging.
The critical question for any incentive strategy is authority: Who actually has the power to change this incentive? Is that person engaged? Have they committed to a timeline? If the answer to any of these is no, the incentive change will not happen, regardless of how prominently it appears in the project plan.
People respond to the incentive system they are actually in, not the one you wish they were in.
No amount of communication changes that fact. The best outcome from rigorous incentive work is not a perfect incentive system on Day One. It is a shared understanding – between the project team, the sponsor, HR, and Finance – of what will change, when, and who is accountable. That shared understanding is itself a form of organizational commitment that makes follow-through more likely and drift less likely.
TOOL
Incentive Alignment Audit
A structured mapping exercise that identifies, for each desired new behavior, the incentive currently rewarding the opposite behavior. The audit surfaces the gap between what the organization says it wants and what it currently rewards—and for each gap, identifies which incentive lever is most feasible to change, who has the authority to change it, and what the realistic timeline is.
Output is an Incentive Gap Report with a prioritized action plan. The most important column in the report is not the gap itself; it is the authority column. Any gap where the responsible party is not named and committed represents a live risk to adoption.
TOOL
Incentive Change Readiness Checklist
A pre-launch gate specifically for incentive alignment. The checklist confirms that formal incentive changes are either complete or on a committed timeline before go-live; that HR, Finance, and relevant leadership have been engaged and have agreed to specific deliverables; and that a monitoring mechanism is in place to track whether incentive changes are being implemented on schedule.
Trigger rule: If more than three incentive gaps are unresolved at launch, escalate to the sponsor for an explicit go/no-go decision. Launching a change initiative with unresolved incentive misalignment is a predictable path to the adoption erosion described above.
FAILURE THREE
There is a specific kind of exhaustion that sets in at organizations running large transformation initiatives. It is not the exhaustion of hard work, though there is plenty of that. It is the exhaustion of constant motion without clear destination—of being perpetually told that important change is underway while remaining genuinely unclear about what, specifically, you are supposed to do differently.
This is the signature of an initiative that has over-invested in communication and under-invested in process clarity. It manifests as employees who can describe the change in the organization’s preferred language—they have absorbed the messaging—but who cannot describe, concretely, what their workflow looks like on the Monday after go-live. They know the transformation is happening. They do not know their part in it.
Change fatigue is widely diagnosed as a root cause of transformation failure. It is not. It is a symptom. The cause is the combination of high change volume, low process clarity, and insufficient employee control over how and when they adapt. When people understand precisely what is changing, have the tools to make that change effectively, and can see progress against a credible timeline, they can absorb significant organizational transformation without burning out. When they are saturated with messaging about change whose practical implications remain vague, fatigue accumulates rapidly.
William Bridges’ model of organizational transition is useful here. Bridges distinguished between change (the external event) and transition (the internal psychological process of adapting to it). Most change management programs address the change with great sophistication and the transition with almost none. They communicate the what and the why extensively. They leave the how—the specific, operational, role-level how—grossly underspecified.
The result is that employees spend an enormous amount of cognitive energy trying to figure out the how on their own. This energy expenditure is invisible on any dashboard that measures communication reach or training completion. It shows up later, in productivity dips, error rates, workarounds, and the quiet reversal of behaviors that appeared to have changed.
TOOL
Change Fatigue Diagnostic
An eight-question pulse survey administered to impacted employee populations at 30-day intervals during active change initiatives. Measures four dimensions: change volume (how much change the employee is experiencing simultaneously), clarity (how well they understand what is expected of them), perceived control (the degree to which they feel they have agency in how they adapt), and emotional load (the cumulative stress of the transition).
Results are reported by team and function, not just in aggregate, to identify hotspots—groups whose scores are significantly worse than the organizational average. Scores below defined thresholds trigger a structured team conversation, facilitated with a manager guide that provides specific prompts for honest discussion without creating additional anxiety. The diagnostic is calibrated to the Bridges Transition Model stages, so facilitators can identify whether a team is in the Uncertainty phase, the Avoidance phase, or beginning to move toward Acceptance.
The clearest test of whether a change initiative has the right balance between communication and process work is a simple one: ask a frontline employee in the most impacted role to walk you through their first three actions on the morning of go-live. If they cannot do it—if the answer involves any version of ‘I think,’ ‘I’m not sure,’ or ‘I’ll wait to see what others do’—the process work is not done, regardless of how many communications have been sent.
Most organizations measure the things that are easy to count: email open rates, town hall attendance, training completion percentages. These metrics tell you whether communications reached people. They tell you nothing about whether people understand what they are supposed to do, or whether they have the capability and confidence to do it.
"Knowing that change is happening is not the same as knowing what to do. One requires a good comms team. The other requires a good process."
There is also a sequencing issue. Most change communication plans front-load the what and why—the vision, the rationale, the urgency—and provide the how closest to go-live, when there is the least time for it to be absorbed. This is the opposite of what a frontline employee needs. They can tolerate a degree of uncertainty about the why. They cannot function effectively without clarity on the how.
TOOL
Change Readiness Assessment
A structured assessment of stakeholder group readiness, administered in the weeks before go-live and designed to produce a genuine go/no-go recommendation rather than a status update. The assessment moves beyond measuring awareness—which most initiatives have already achieved in abundance—to measuring understanding (can the employee explain the new process?), ability (do they have the skills and tools to perform it?), and willingness (do they intend to adopt it?).
Output is a readiness dashboard by stakeholder group, with explicit red/yellow/green ratings and a recommended decision. If the assessment reveals that a critical stakeholder group is not ready, the right answer is to delay go-live or resource the gap, not to proceed and plan to fix it afterward.
TOOL
Communication-to-Process Ratio Audit
A structured inventory of planned change communications mapped against the process artifacts that exist to support them. For every communication that tells employees what is changing, there should be a corresponding artifact that shows them how to do it: an updated standard operating procedure, a role-specific job aid, a workflow diagram, a quick-reference guide, or a training module that covers the specific process steps, not just the initiative’s rationale.
Red flag threshold: If planned communications outnumber process artifacts at a ratio of 3:1 or higher, the initiative is over-indexed on messaging and under-resourced on operational support. The audit also checks for the minimum required process artifacts before any go-live: updated SOPs validated by the people who will use them; role-specific workflow documentation that reflects actual job responsibilities; explicit escalation paths for when something doesn’t work; and defined support resources for the first 30 days post-launch.
It is rare for a single initiative to create unbearable change fatigue on its own. What creates it is the accumulation: five initiatives running simultaneously across overlapping employee populations, each with its own communication cadence, each competing for the same 40-hour work week, each asking for behavioral changes that are, taken individually, reasonable, but taken together, impossible to sustain.
Most organizations do not have a clear view of their cumulative change load because change initiatives are typically managed in silos. Each project team sees its own initiative. No one is looking across the portfolio at what is being asked of the same group of people at the same time.
TOOL
Change Portfolio Heat Map
A visual mapping of all active change initiatives against the employee populations they affect, designed to surface overlap, timing conflicts, and competing behavioral demands that are invisible when initiatives are managed in isolation. The heat map identifies which employee groups are being asked to absorb the most change simultaneously, which initiatives are colliding at the same inflection points, and where there are opportunities to sequence, integrate, or deprioritize initiatives to reduce cumulative load.
This is a capacity planning tool for human beings. Its output informs sequencing decisions, resourcing decisions, and, when necessary, the difficult conversation about which initiatives need to be delayed or deprioritized to give the highest-priority work a realistic chance of success.
CASE STUDY
70+ improvement opportunities identified; 20 quick-win actions and 3 major initiatives launched immediately
A professional services firm that knew its reporting process was broken but had no concrete picture of where. Adonis used SIPOC and value stream mapping to surface the specific bottlenecks, producing an actionable list of what to do differently rather than more communication about the problem.
FAILURE FOUR
The fourth failure is the most operationally costly and the most preventable. Organizations regularly design and deploy change initiatives—new technology, harmonized processes, restructured workflows—against a current state they have never formally observed, mapped, or validated. They proceed on the assumption that leadership understands how work gets done today. That assumption is almost always wrong at the level of detail that matters when something breaks.
This is not a failure of competence. Senior leaders are not expected to know every step of every process. It is a failure of method. Current-state process understanding requires deliberate investigation—going to where work happens, watching it happen, asking the people who do it every day what it actually involves, and mapping what you find against what the standard operating procedures say. The gap between those two things is frequently larger than anyone anticipated, and it is in that gap where transformations quietly fail.
A company with a distributed field workforce (technicians, inspectors, service representatives) uses a mobile application to capture data during site visits. The application feeds a workflow that routes data through internal systems and ultimately populates client-facing reports. The company approves a platform upgrade. The project team does thorough work: requirements are documented, the new system is tested, training is developed, and go-live goes according to plan.
Three weeks after launch, a client escalates. A data field that appeared in their monthly compliance report is no longer being captured. The field existed in the legacy application. It was used by the client’s team to trigger a downstream workflow on their side. It was not in any SOP. It was not in the requirements documentation. It was discovered on a user-by-user basis, informally, over time, and had become a standard part of how the field workforce operated. The project team never found it because they never observed the work. They built requirements from documentation that was two years out of date. The result: emergency re-development, manual data reconstruction, and a client relationship placed under significant strain—all of which was entirely preventable.
A manufacturing organization with production facilities in multiple states and provinces undertakes a process harmonization initiative. The goal is sound: reduce variation, create a single standard, enable cross-site benchmarking and workforce mobility. A harmonized quality control process is developed at headquarters, piloted at the flagship facility where conditions are well-understood, and then rolled out system-wide.
What the design team did not know: three facilities operate under state or provincial environmental regulations that require documentation steps not present in the harmonized process. Two facilities have collective bargaining agreements that specify who may perform quality checks and under what conditions. One facility serves a key customer whose supply agreement includes a process specification as a contractual requirement.
None of this information was concealed. It simply was not asked for, because the design process assumed that the flagship pilot was representative of the system. It was not. The result was compliance exposure, a union grievance, a customer escalation, and a re-design process that cost significantly more—in time, money, and organizational credibility—than a proper current-state assessment would have.
The lesson is not that harmonization is wrong. It is that you cannot design a one-size-fits-all solution until you understand which variations are discretionary and which are load-bearing. Discretionary variation can and should be eliminated. Load-bearing variation—the kind that exists because of a regulation, a contract, a safety requirement, or a physical constraint—must be understood before anything is built to replace it.
CASE STUDY
70+ improvement opportunities identified; 20 quick-win actions and 3 major initiatives launched immediately
A professional services firm that knew its reporting process was broken but had no concrete picture of where. Adonis used SIPOC and value stream mapping to surface the specific bottlenecks, producing an actionable list of what to do differently rather than more communication about the problem.
Standard operating procedures describe the intended process—the way work is supposed to happen. Observation reveals the actual process—the way work does happen. In organizations with mature, well-maintained process documentation, the gap between these two is small. In most organizations, it is significant. Steps that were added informally to solve a recurring problem. Workarounds that became standard practice after a system limitation was never fixed. Undocumented checks performed by experienced employees who learned from mistakes that never made it into the SOP. Informal hand-offs between roles that are not represented anywhere in the official workflow.
This gap is not evidence of organizational failure. It is evidence of operational reality. Organizations are living systems, and they adapt in ways that documentation rarely captures. The problem arises when a change initiative treats the documentation as ground truth and builds a future state against it, leaving the operational reality—all the adaptations, workarounds, and informal knowledge—to surface at go-live, when the cost of discovering it is at its highest.
"You cannot design a better process if you don’t understand the process that exists. You are not improving anything - you are replacing one set of unknowns with another."
TOOL
SIPOC Analysis
A structured current-state analysis tool that maps Suppliers, Inputs, the Process itself, Outputs, and Customers for any workflow being redesigned. In a change management context, the SIPOC serves a specific and critical purpose: it forces the design team to name every input entering the process and every output leaving it before any future-state design begins.
The integrity rule that cannot be compromised: every input and output identified in the SIPOC must appear on the process map. Any gap is a live risk—it means the team does not fully understand where the process begins, where it ends, or who receives what it produces.
For technology implementations, the SIPOC is particularly powerful when applied at the data-field level: every piece of data the current system captures should be treated as an output and traced to its downstream consumer before any new system is specified. The missing field scenario described above would not have occurred if this step had been completed.
TOOL
Current-State Process Map
A swim-lane process map of the current-state workflow, built from direct observation and validated by the people who perform the work—not from existing SOPs, which should be treated as a starting hypothesis rather than a source of truth.
The map should capture: who performs each step, in what sequence, with what inputs and what outputs at each stage, and what decisions are made along the way. An annotation layer identifies which steps are regulatory requirements, which are contractual obligations, which are customer-specified, and which are discretionary. For multi-site deployments, each site is mapped independently first, and maps are then overlaid to distinguish common core from site-specific variation.
Critical validation check: every SIPOC input and output must appear somewhere on the process map. A common finding in this work is that 20 to 30 percent of actual process steps are not represented in existing documentation.
TOOL
Process Observation / Go-and-See Diagnostic
A structured field observation exercise in which practitioners go to where the work is performed and watch it being done. This is not an interview. It is not a survey. It is not a review of documentation. It is direct observation—the discipline that Lean and continuous improvement professionals know as gemba, applied here with explicit change management intent.
Observation reveals what interviews do not: the workarounds people have developed for system limitations, the informal steps that experienced employees perform automatically without recognizing them as steps, the environmental and physical constraints that shape how a process actually runs, and the gap between what people say they do and what they do. For field-based workforces in particular—where the process happens across dozens or hundreds of locations and is mediated by mobile technology—direct observation is frequently the only reliable way to understand the current state.
Output of the observation exercise is a summary report with a gap analysis comparing observed practice to documented process. Any gap that cannot be explained is a risk to be resolved before future-state design proceeds.
Once the current state is understood and the future state has been designed against that understanding, the most operationally useful communication tool is one that most change plans omit entirely. Not the town hall video. Not the FAQ document. Not the email from the CEO. Those have their place. But for the employee whose workflow has changed—whose specific, day-to-day actions are different starting Monday—the most useful thing is a clear, role-specific answer to the question they are actually asking: What do I do differently, and what do I stop doing?
Abstract vision communication does not answer this question. The Start / Stop / Continue framework does.
TOOL
Start / Stop / Continue
The most operationally useful change communication tool for employees whose workflow has changed. For each impacted role, the framework specifies three things: what the employee should Start doing that they do not do today; what they should Stop doing that is no longer part of the process; and what they should Continue doing because it has not changed.
The Stop list is the most commonly omitted element of change communication, and its absence is costly. When employees are not explicitly told what to stop, they continue doing it—alongside the new behaviors—creating redundant effort, data inconsistency, and, in some cases, compliance risk.
Format requirements: role-specific, not initiative-wide. The field technician and the supervisor have different Start/Stop/Continue lists. Timing: delivered at or immediately before go-live, not weeks earlier when it cannot be acted on. Paired with: an updated process map showing the new workflow, and an explicit escalation path for the first 30 days when something doesn’t work as expected.
SYNTHESIS
The four failures described in this paper are individually damaging. Together, they are self-reinforcing in ways that make them progressively harder to address the longer they go unexamined.
The sequence runs as follows. When leaders are not genuinely aligned with the change (Failure One), they do not invest in the slow, careful work of understanding the current state before designing the future one (Failure Four). Current-state assessment feels expensive and slow when leadership is signaling urgency without demonstrating patience. The result is a future-state design built on assumptions.
Without current-state understanding (Failure Four), incentive redesign is guesswork (Failure Two). You cannot identify which behaviors to reward until you understand what the process actually requires at the operational level. Incentive design built on assumed process understanding will reward behaviors that look right from the executive level and miss the ones that matter on the floor.
When incentives don’t change (Failure Two), employees learn to perform compliance with the new system while continuing the behaviors that the old incentive structure rewards. The organization responds to this performance gap by escalating communications—more town halls, more messaging, more urgency—rather than examining the structural misalignment underneath it. This is where change fatigue originates (Failure Three). Not from too much change, but from too much messaging about change that employees cannot act on because the process is unclear and the incentives point in the wrong direction.
When fatigue sets in (Failure Three), the organization’s capacity for the deliberate, time-intensive work of current-state assessment (Failure Four) disappears entirely. Everyone is too busy managing the change to understand it. The loop closes.
Breaking the cycle requires addressing all four failures, and sequencing them correctly. The sequence that works is the reverse of how most initiatives are structured:
These steps are not glamorous. They do not show up well in project Gantt charts. They are also, consistently, the difference between a transformation that delivers and one that does not.
Effectiveness = Quality of Solution × Acceptance of Change. The formula has always included both sides. Most initiatives solve hard for the left side while assuming the right side will follow. It does not.
PRACTITIONER TOOLKIT
The tools described in this paper are structured approaches to doing the work that most change initiatives skip. The table below summarizes each tool, the failure it addresses, and its format.
Tool | Addresses | Format |
Leadership Alignment Assessment | Failure 1 – Sponsor Alignment | Facilitated assessment + scoring guide |
Incentive Alignment Audit | Failure 2 – Incentives | Gap analysis matrix |
Incentive Change Readiness Checklist | Failure 2 – Incentives | Pre-launch gate checklist |
Change Fatigue Diagnostic | Failure 3 – Fatigue & clarity | Pulse survey + manager guide |
Change Readiness Assessment | Failure 3 – Change process clarity | Stakeholder dashboard / go/no-go |
Communication-to-Process Ratio Audit | Failure 3 – Balance | Inventory checklist |
Change Portfolio Heat Map | All failures – cumulative load | Visual portfolio map |
SIPOC Analysis | Failure 4 – Current state | Structured template |
Current-State Process Map | Failure 4 – Current state | Swim-lane map + annotation guide |
Process Observation / Go-and-See | Failure 4 – Current state | Field observation guide |
Start / Stop / Continue | Failure 4 – Workflow communication | Role-specific communication template |
These tools work best when deployed in sequence, not in parallel. The SIPOC and process map (Tools 9 and 10) should be completed before the future-state design is finalized. The Leadership Alignment Assessment (Tool 1) should be administered before the project charter is approved. The Incentive Alignment Audit (Tool 3) should be completed before the communication plan is developed. The Change Readiness Assessment (Tool 6) should produce a go/no-go decision, not a status update.
The most common misuse of these tools is deploying them after the decisions they are designed to inform have already been made. A process map built after go-live is documentation. A sponsor assessment conducted after the initiative has stalled is a post-mortem. The value of these tools is diagnostic and preventive—they surface problems when there is still time to address them.
BEFORE YOU LAUNCH
The questions below are forcing functions—designed to surface the structural misalignment that, if left unaddressed, will determine the outcome of the initiative more reliably than any project plan. They are uncomfortable to ask. That is the point.
Not ‘support the initiative.’ Not ‘allocate resources.’ One specific, observable behavior change that the sponsor will make as a result of this transformation. If they cannot name it, the sponsorship is performative.
Approved for change is not the same as changed. If the performance review criteria, bonus structures, and promotion rubrics still reward the old behaviors on go-live day, the initiative will produce compliance theater, not behavioral change.
SOPs are a starting hypothesis. Observation is the evidence. If no one on the design team has spent time watching the work happen—in the field, on the floor, at the point of execution—the future-state design is built on assumptions that will surface as problems at the worst possible moment.
This is a technical check, and it is not negotiable. Any gap between the SIPOC and the process map is an undiscovered dependency—a data flow, a handoff, a downstream consumer—that will fail silently until someone escalates.
Not their understanding of why the change is happening. Their specific, operational workflow on the morning after go-live. If they cannot walk you through it, the process work is not done. More communications will not fix this.
This initiative is not happening in a vacuum. The employees it affects are also absorbing other changes, other priorities, and other demands on their attention. If the cumulative load is already at capacity, adding another initiative without sequencing or integrating it is not a project management decision—it is a capacity decision with human consequences.
Go-live dates are typically treated as commitments. They should be treated as decision points. Define in advance what ‘ready’ looks like—minimum readiness scores by stakeholder group, confirmed incentive changes, validated process documentation, sponsor commitment at the Ownership level—and give someone the authority and the expectation that they will call a delay if the criteria are not met. An initiative that launches not-ready will cost more to fix than the delay would have cost.
CONCLUSION
The 70% failure rate is not a verdict on the difficulty of change. It is a measurement of how consistently organizations misdiagnose what is standing in the way of it. The reality is that most organizations don’t need a new change framework; they need a more honest diagnosis. The organizations in the 30% are not immune to the Change Failure Stack. They are simply more disciplined about addressing it early.
Change does not fail primarily because employees resist it—though they do, and that resistance deserves to be taken seriously rather than managed with messaging. Change fails because the structures surrounding employees make the old behavior rational, safe, and rewarded. It fails because the new process was designed against a current state no one actually examined. It fails because the leader championing it had reasons—real, structural, incentive-driven reasons—to ensure it never fully succeeded.
These are uncomfortable things to say in a steering committee meeting. They are also, in most failed transformations, the most accurate description of what happened.
The four failures in this paper are not exotic. They do not require a new methodology to address. They require honesty: about what leaders are genuinely willing to give up, about whether incentives have actually been redesigned or merely discussed, about whether the process was observed before it was replaced, and about whether employees have been given the specific, operational clarity they need to do their jobs differently—not just the inspiration to want to.
The organizations that succeed at transformation are not smarter than the ones that don’t. They tend to ask the uncomfortable questions before the project charter is approved. They treat current-state assessment as foundational rather than optional. They insist that incentive alignment is an outcome to be measured rather than a workstream to be checked off. They give their change readiness assessment the authority to delay a launch rather than just document a concern.
None of that is easy. It requires sponsors who can tolerate an honest examination of their own commitment. It requires project teams with the standing to escalate a readiness concern rather than suppress it. It requires organizations that treat the failure rate as something to be explained and addressed rather than accepted as the cost of ambition.
It is, however, entirely doable. The tools exist. The frameworks exist. What has been missing, in too many initiatives, is the willingness to use them honestly.