Using Boxplots for Data Visualization and Process Insights

What Are Boxplots
Through the visual representation of a dataset, boxplots are very informative and very useful when comparing distributions between two or more processes. Essentially, boxplots summarize the following statistics:
- The lower whisker contains 25% of the data (first quartile, or Q1)
- The box itself contains 50% of the data (inter-quartile range)
- The upper whisker contains 25% of the data and up to it, 75% of the data (third quartile, or Q3)
- The line right in the middle of the box is normally the median, Q2 (although some statistical software may also display the mean)
- Outliers are far away data points that are usually 1.5 greater in value than the length of the box itself (the inter-quartile range)
The Five-Number Summary
The Five-Number Summary is what is displayed graphically in a boxplot. The five numbers are:
- The minimum value (Q0)
- The first quartile (Q1)
- The median (or second quartile, Q2)
- The third quartile (Q3)
- The maximum value (Q4)
Practical Example
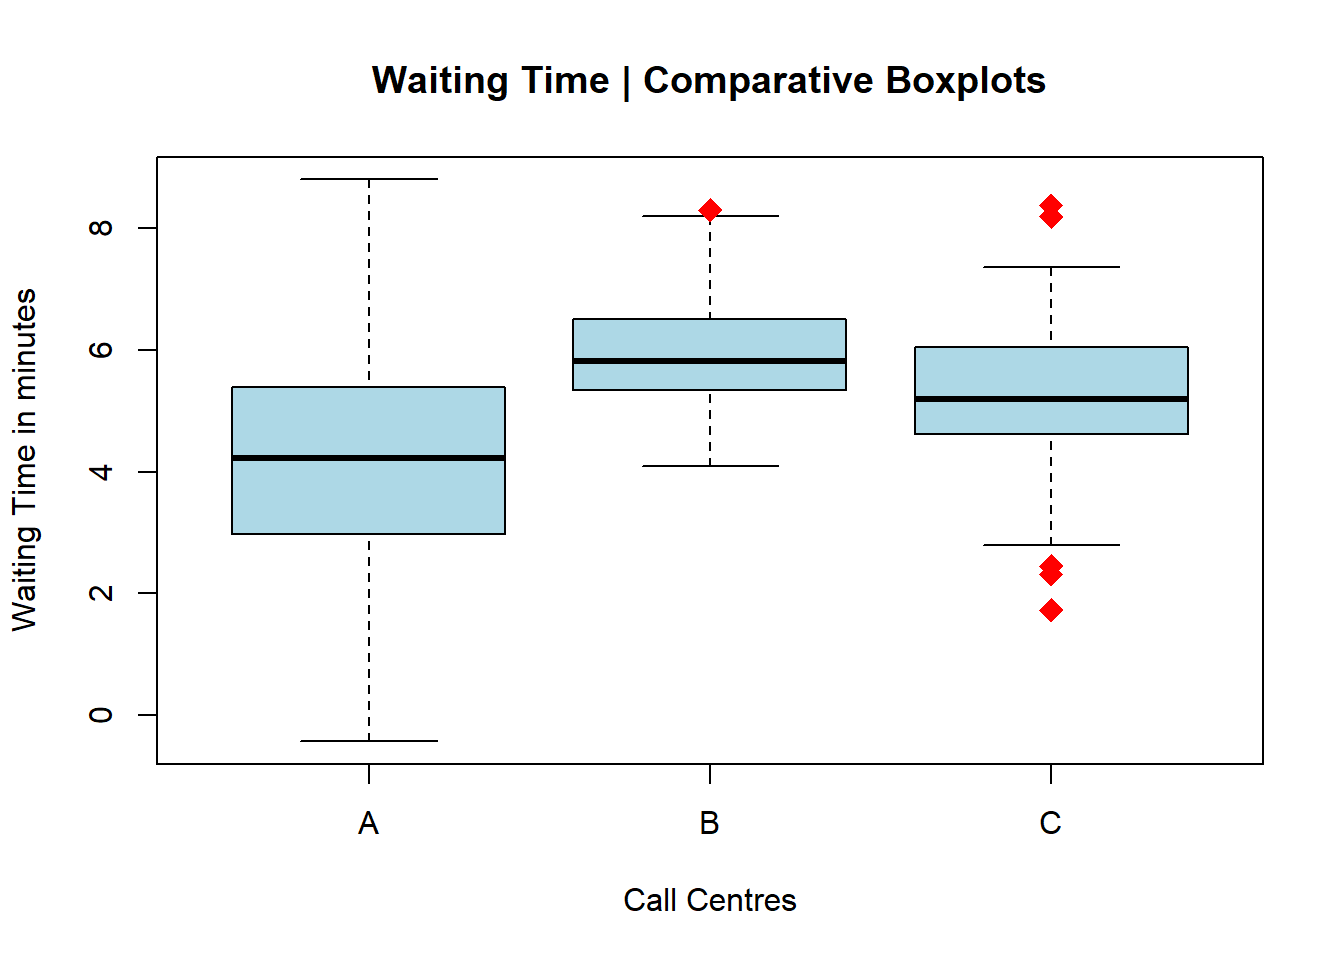
A call centre manager wishes to know how long it is taking for three distinct branches (A, B, and C) to respond to client calls. The following comparative boxplots suggest that: 1) branch A has the greatest amount of variation (size of the box and extent of whiskers) however a lower median response time, 2) branches B and C have less variation however slower median response times, and 3) branches B and C showcase outliers in their processes; branch C in this case on both ends of the upper and lower whiskers.
Boxplot Limitations (Words of Caution)
Boxplots do not always display the number of data points being graphed. For example, one might be looking at two comparative boxplots, the first one with only 5 distinct numbers (the Five-Number Summary that is displayed in a boxplot), and another one with 500 data points, making it a stronger representation of that process’s central tendency and spread. So, use caution when interpreting boxplots!
The Boxplotly Playground
Check out this web app built by the author of this post to learn more about and interactively play with Boxplots online.

I love Continuous Improvement and Data Analytics. The world would be a better place if our kids were taught more process excellence and statistical analysis at school.